Clients do not need a map. They need to know the volume, the progress, and where the problem is. The map is an intermediate step.
Basic measurements
Distance and area. Measured directly on the orthomosaic. Simple and the most frequently used.
Elevation and height difference. From the elevation model.
Volume. Between the current surface and a reference surface. The primary application in construction and quarrying.
Slope. Derived from the elevation model. Used for planning and for landslide risk assessment.
Profiles. Height along a chosen alignment. Needed for road and channel design.
Contours. Generated from the elevation model.
Object counts. Trees, vehicles, structures, ponds. Semi-automatic or manual.
Accuracy inheritance. Every measurement carries the error of the underlying product. State it.
Record how each figure was derived. Which surface, which reference, which method. A number without its method cannot be defended.
Change over time
The main value of repeat flying. One survey gives condition; a series gives trend.
Prerequisites for comparison. Same coordinate system, same control monuments, comparable accuracy.
Height difference. For earthwork volumes, erosion, landslide movement, sedimentation.
Land cover change. Forest loss, encroachment, new construction.
Construction progress. What is complete relative to the previous period.
Beware of noise. A difference smaller than the measurement error is not a finding. This is the most common interpretation failure.
Calculate a detection threshold. From the combined error of the two surveys. Report only changes exceeding it.
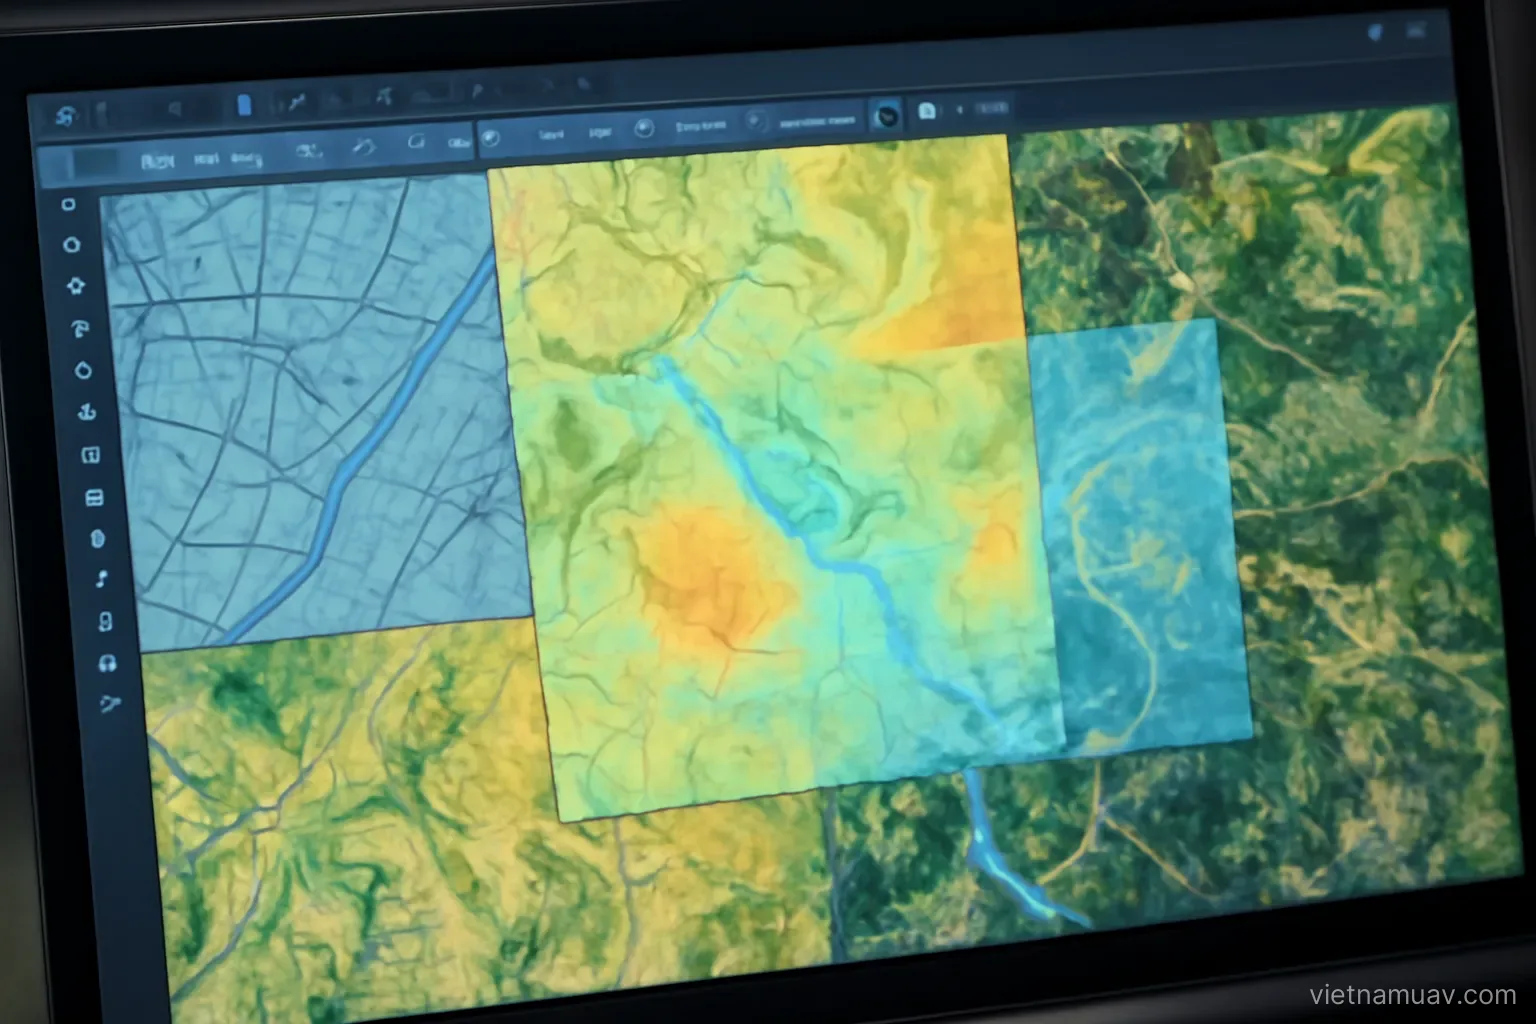
Present visually. A difference map with colour showing gain and loss communicates immediately.
Keep the comparison honest. If the two surveys used different methods or control, say so rather than presenting the difference as though it were clean.
Automated and semi-automated analysis
Land cover classification. Dividing the imagery into classes. Semi-automatic and requiring review.
Change detection. Comparing two dates and flagging differences, reducing what has to be examined manually.
Object detection. Counting trees, vehicles or structures using trained models. Efficient at scale.
Training data required. For your context. Generic models generally perform poorly on aerial imagery in local conditions.
Always sample-check. Count a small area manually and compare with the automated result. That gives you the real accuracy.
Report the accuracy. An automated count is not an exact figure. State the error rate.
Do not automate prematurely. For small volumes, manual work is faster and more accurate than building a pipeline.
Automate when the task repeats. Many times, on consistent data.
Keep the manual method available. When the automated result looks wrong, you need something to check it against.
Presenting the result
Know the reader. An engineer wants detail; a director wants conclusions and imagery.
Conclusion first. The opening page states the finding. Detail follows.
Specific numbers. How many cubic metres, how many hectares, what percentage change.
Annotated imagery. Saying what is shown and why it matters.
Side-by-side comparison. Two dates together. Very effective at conveying change.
Accuracy and limitations prominently. Not buried in an appendix.
Usable format. A document that can be opened and searched, not a screenshot.
Keep it short. Long reports are not read. State what matters and put detail where it can be found.
Use consistent presentation across visits. A client comparing this month with last should not have to relearn the layout.
Moving from data supply to advice
Sell outcomes, not flights. Clients pay for information they can act on.
Understand their sector. What decisions they make and what they need to make them.
Ask how they used it. After delivery. The answer tells you what to improve.
Raise things proactively. If you see a problem in the data, mention it even if it falls outside the brief.
Build a record over time. Repeat surveys accumulate value, and a client with history is harder to displace.
Standardise the process. Faster and more consistent across projects, which lowers cost and raises quality simultaneously.
Integrate with their systems. Deliver data into the software they already work in.
Measure the value delivered. Days saved, problems caught, losses avoided. That figure is the basis for retaining the contract and for raising the price.
Say when a flight is not needed. Declining unnecessary work builds more trust than accepting it, and it comes back as larger work later.
Frequently asked questions
What is required for two surveys to be comparable?
Same coordinate system, same control monuments, and comparable accuracy. Without those, observed differences may be nothing more than measurement error.
What is the most common interpretation failure?
Reporting a change smaller than the combined measurement error of the two surveys. A detection threshold must be calculated and only changes exceeding it reported.
When is automating analysis worthwhile?
When the task repeats many times on consistent data. For small volumes, manual work is faster and more accurate than building a pipeline.
How does a provider move from supplying data to advising?
By understanding what decisions the client makes, raising issues proactively even outside the brief, and measuring the value delivered in days saved or losses avoided.
More in Airspace rules and permits and Operations and safety.