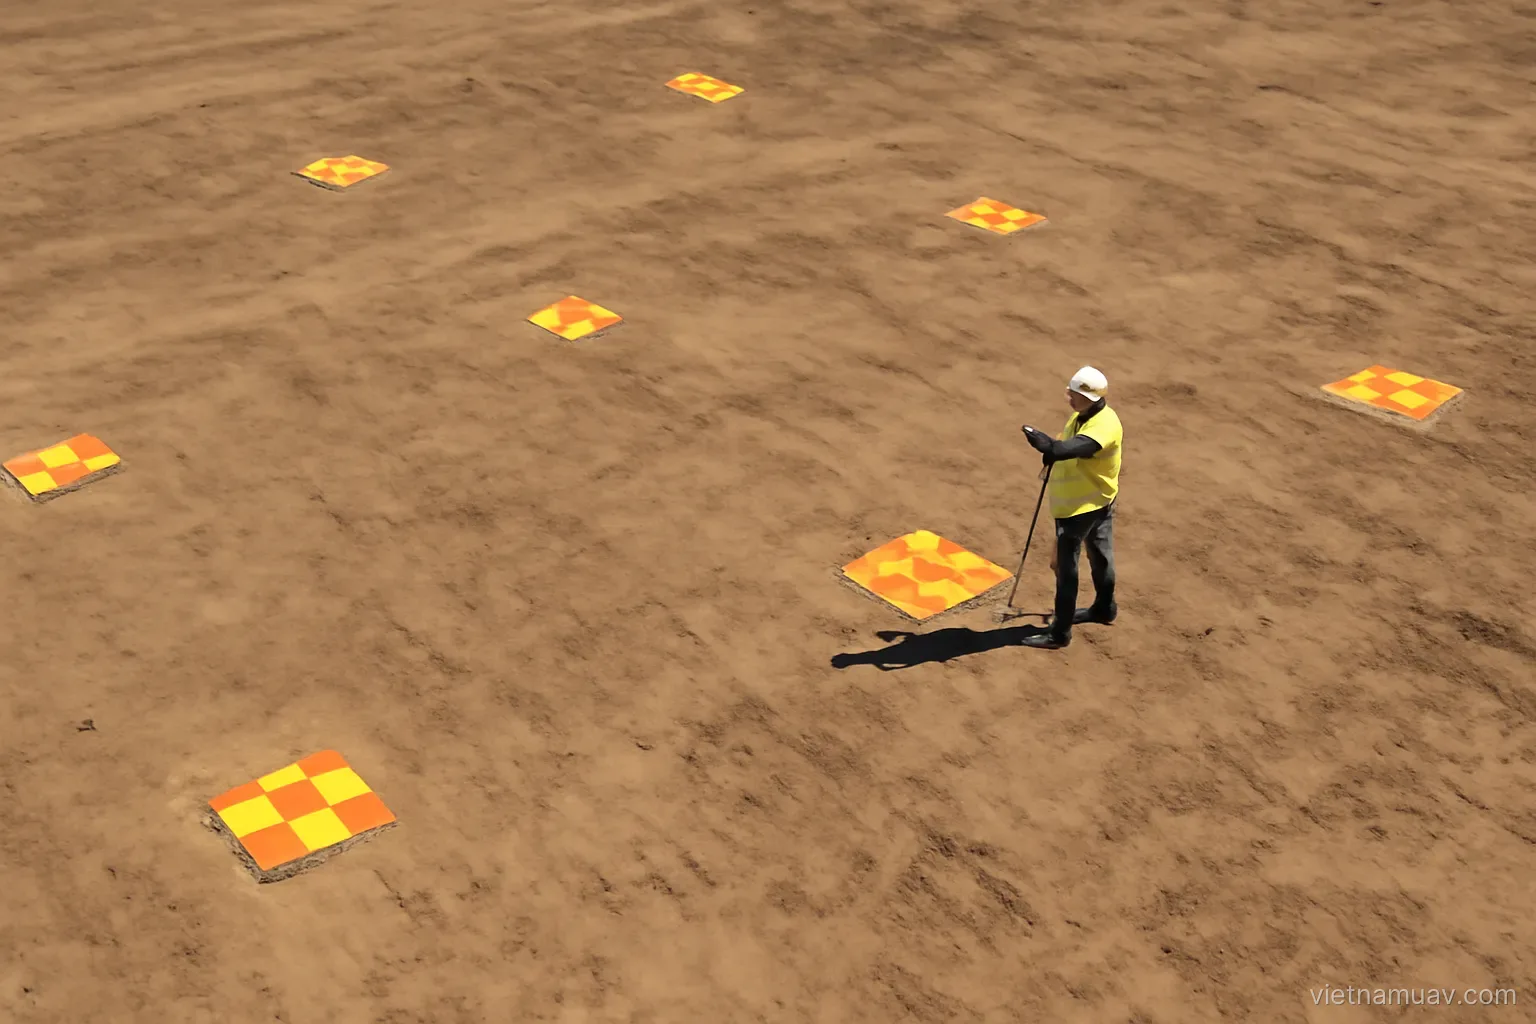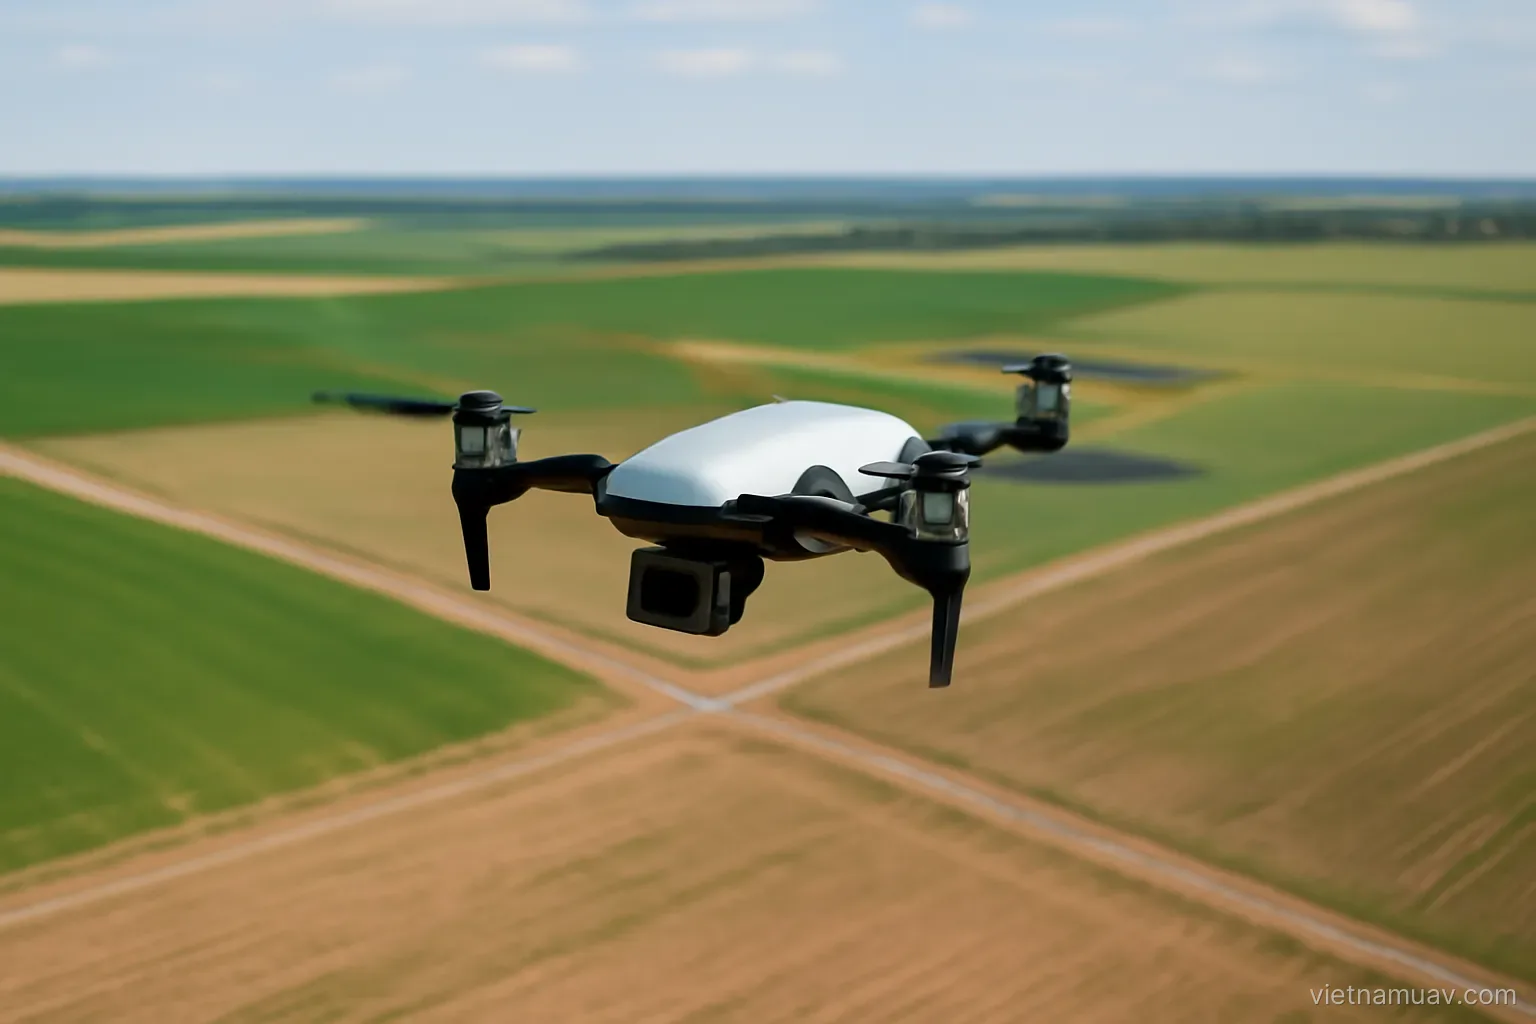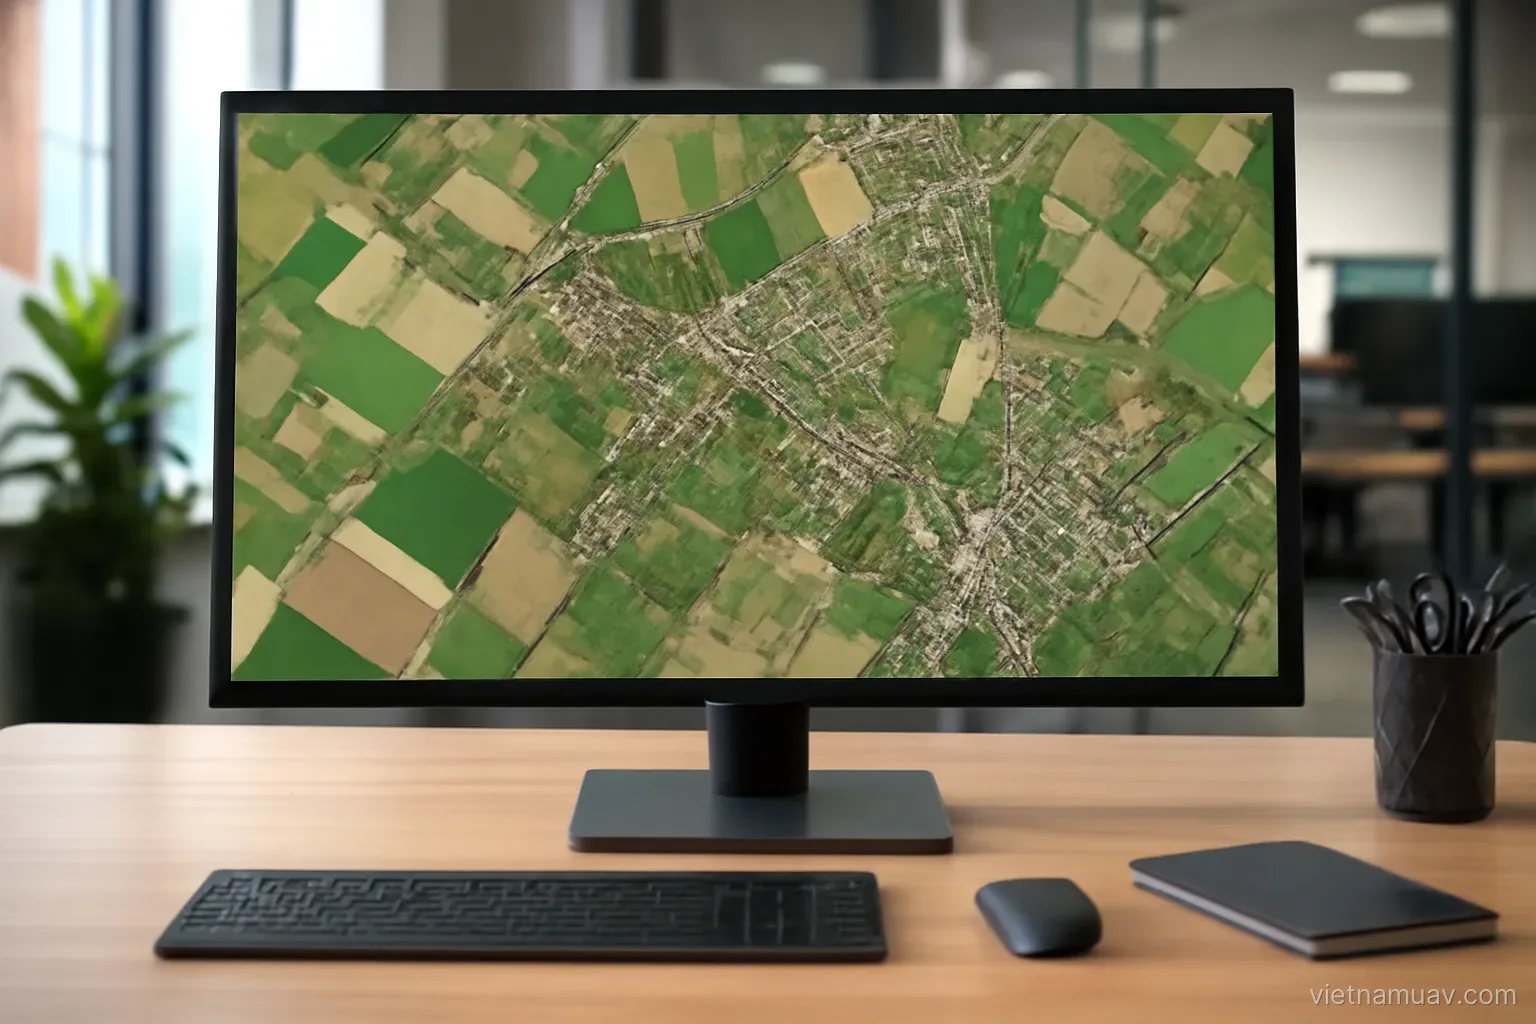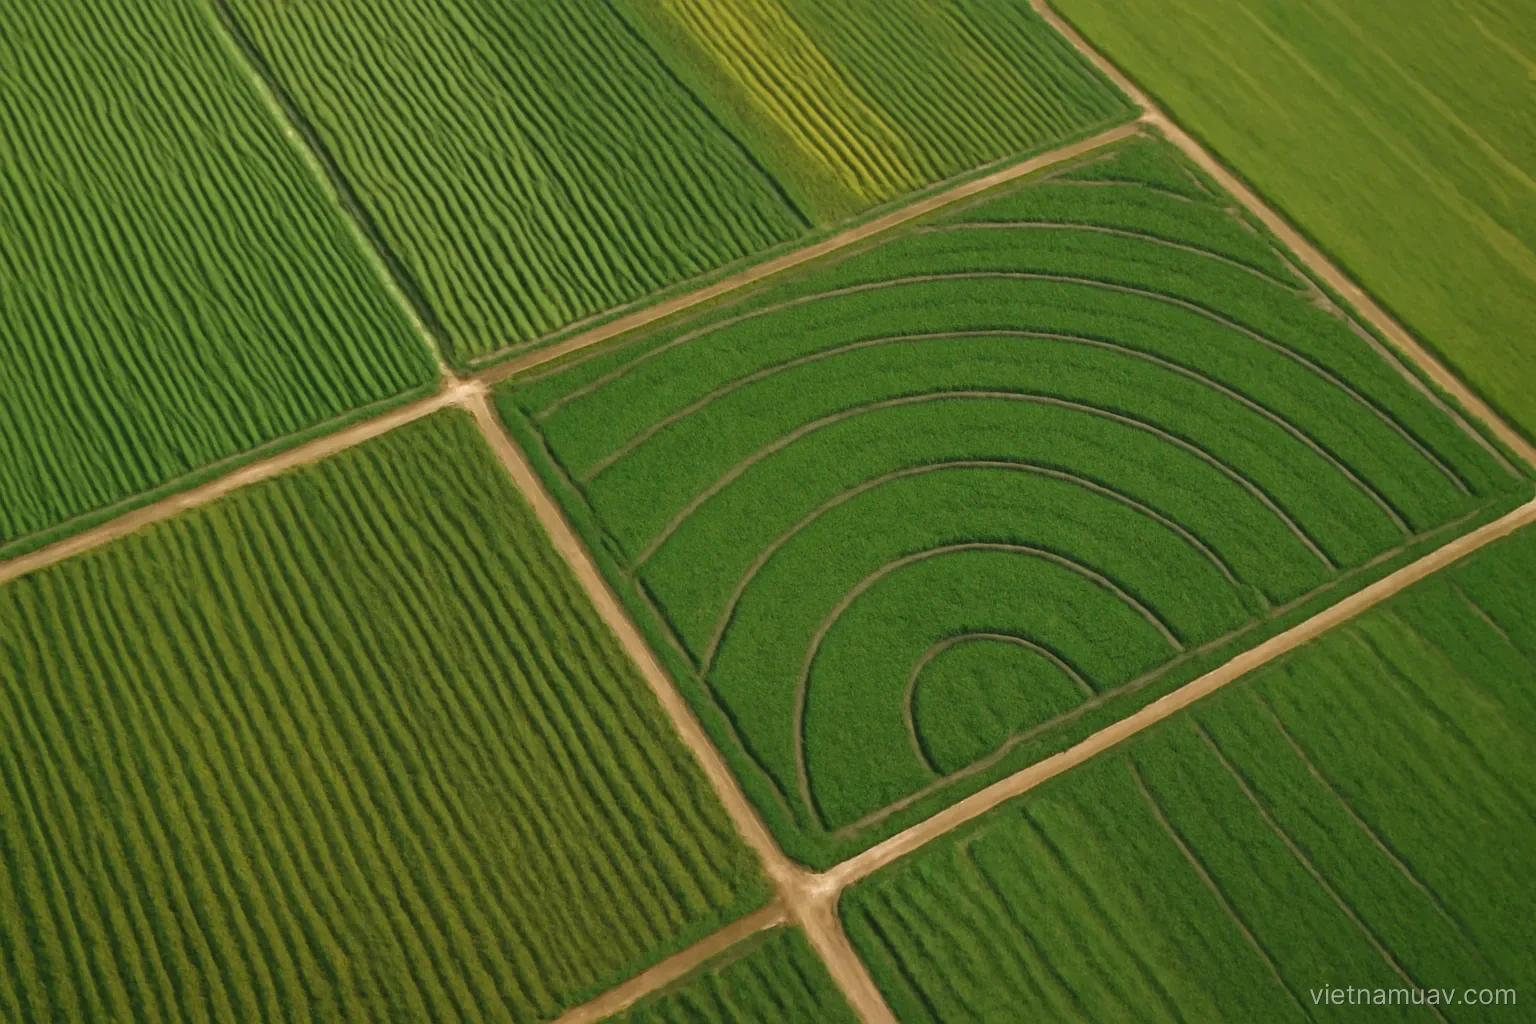
Agriculture and forestry are the fields where drone survey has the clearest untapped potential in Vietnam, and also the fields where overselling is easiest. The difference lies in understanding what the data can and cannot tell you.
Choosing the sensor
Standard colour camera. The cheapest option and more useful than most people assume. It shows density, gaps, waterlogging, weed pressure and physical damage.
Multispectral. Adds near-infrared and red-edge bands, enabling the vegetation indices that reflect plant condition.
Thermal. Measures surface temperature, which relates to plant water status — stressed plants run warmer.
Laser scanning. Measures canopy structure and height. Used in forestry for biomass estimation.
Match sensor to question. Counting trees and assessing establishment needs only a colour camera. Detecting stress before it is visible needs multispectral.
Calibration. Multispectral requires a reflectance panel imaged before and after each flight. Without it, values cannot be compared between flights.
Cost discipline. Multispectral costs several times a standard camera. Buy it once a specific, recurring question justifies it, not before.
Reading vegetation indices honestly
The physics. Healthy leaves reflect strongly in the near infrared and absorb strongly in the red. The ratio between bands reflects leaf condition.
What the resulting map shows. Where plants are performing worse than elsewhere in the same field at the same moment. It is a relative comparison.
What it does not show. Cause. Water deficit, nutrient shortage, pest damage, poor soil and late planting all produce the same signal.
This is the most common misunderstanding in the field. An index map is not a diagnosis. It identifies where to go and look, and going to look is not optional.
Saturation. Once canopy closes, the standard index stops discriminating. Later growth stages need a different measure.
Comparability between flights. Only holds with correct calibration and similar illumination.
Where the genuine value lies. Catching problems early in areas nobody walks, and quantifying how much area is affected.
Ground truthing. Visit several flagged areas and confirm. This builds trust and improves your interpretation over time.
Specific applications
Tree counting. In orchards and plantations. An exact figure instead of an estimate, useful for management and insurance.
Establishment assessment. Counting survival after planting across large areas far faster than walking.
Drainage and waterlogging. Visible from colour imagery, and confirmed by thermal.
Boundary mapping. More accurate than legacy records in many cases.
Forest biomass estimation. From canopy height and cover, using species-appropriate conversion models.
Erosion and landslide monitoring. Comparing terrain models across time.
Aquaculture monitoring. Counting ponds, measuring area, detecting change.
Encroachment detection. Illegal clearing or land occupation, with coordinates and a date attached.
Flying conditions specific to this work
Time of day. Near midday gives the shortest shadows, which suits index work. But harsh sun causes glare on wet foliage.
Avoid flying after rain. Water on leaves distorts reflectance readings.
Growth stage. Flying at the wrong stage produces data nobody can act on. Too early and canopy has not closed; too late and intervention is pointless.
Terrain. Terraced fields and slopes require terrain-following flight to keep ground resolution consistent.
Large areas. Extensive fields need many batteries or a fixed-wing platform with longer endurance.
Obstacles. Power lines crossing fields and isolated tall trees. Survey them beforehand.
People and livestock. Farm workers are present. Notify in advance and do not overfly them.
Dust and insects. Accumulate on the lens. Check and clean frequently.
Turning data into decisions
Data has no value by itself. A beautiful map that changes nothing is not worth what it cost.
Ask first. What will the recipient do with this information. If nobody can answer, the flight is premature.
Connect to specific action. This block needs more nitrogen, that block needs pest inspection, this corner needs drainage work.
Simplify the output. A grower needs a simple zone map, not a point cloud.
Quantify. Hectares affected, estimated loss. Numbers drive decisions in a way that colours do not.
Verify on the ground. Check several flagged areas and confirm or refute. This is what turns a flight service into an advisory service.
Close the loop. Fly again after intervention and check whether it worked. This is where the long-term commercial value sits.
Be honest about limits. Selling drones as a solution to every agronomic problem damages the whole sector when clients are disappointed.
Frequently asked questions
What does a vegetation index map actually tell you?
Where plants are performing worse than elsewhere in the same field at the same moment. It does not tell you why — water, nutrients, pests and late planting all look the same.
When is a standard colour camera sufficient?
For counting trees, assessing density and establishment, and spotting gaps, waterlogging or weed pressure. Multispectral is worth buying only once a specific recurring question justifies it.
Why does multispectral work require a calibration panel?
Because without it, reflectance values cannot be compared between flights or between different lighting conditions, which removes most of the analytical value.
What question should be answered before flying an agricultural survey?
What the recipient will do with the information. If nobody can answer that, the data will not lead to any action regardless of how good it looks.
More in Airspace rules and permits and Agricultural UAV.